


FireBridge Bridges what??
Bridging the GAP

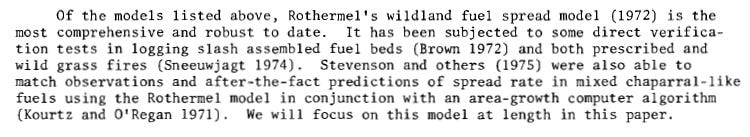
In 1972, Research Paper INT-115 is produced and is titled
“A MATHEMATICAL MODEL FOR PREDICTING FIRE SPREAD IN WILDLAND FULES”.
The purpose of which is stated in the first paragraph of the Abstract and was: …to develop a mathematical model for predicting rate of fire spread and intensity applicable to a wide range of wildland fuels.
The second paragraph goes on to state that the model is complete in the sense that
"no prior knowledge of a fuels burning characteristics is required. All that is necessary are inputs describing the physical and chemical makeup of the fuel and the environmental conditions in which it is expected to burn.”
The abstract continues by saying that “Inputs include fuel loading, fuel depth, fuel particle surface-area-to-volume-ratio, fuel particle heat content, fuel particle moisture and mineral content and the moisture content at which extinction can be expect. Environment inputs are mean wind velocity and slope of terrain.”
The abstract finally states that the fuel models is introduced wherein parameters of wildland fuels for inputs to the model are categorized and tabulated. These are then used to predict fire spread and intensity; this eliminates the necessity for repeatedly measuring such parameters.
Hence, the Fire Behavior Nomograms that contain all of these mathematical inputs of fuel models, is PRECISELY what FireBridge uses to determine the number and type of resources. Keep this in mind. FireBridge is NOT creating a new mathematical modeling criteria, it is using existing methods that have been proven and used for the past 50 plus years!
BehavePlus 6.0 that we use today, uses the past decades research and incorporates such into their software.
Frank Albini, in 1976 wrote the following in his below named research paper.
The Fire Nomograph’s were not originally constructed by Rothermel as I understand it, but by Frank Albini in 1976 using Rothermels equations and was first put together in Research Paper INT-030. This 100 page document shows the first Nomograph and explains how to use it on page 8.
On page 8 of Research Paper INT-30 (Albini, 1976), “These set of graphs, or working charts, are technically called nomographs, meaning graphical aids for the computation of numbers”.
Page 8 of Albini’s report explains how to use the nomographs. Out of Albini’s 100 pages, including pages 1-4, that cover the uses of fire behavior models, as like Rothermel, nothing is discussed on using the outputs of the equations or the nomographs as aids to calculating the other side of the heat energy equation as what is being generated to how much equivalent water in Btu per pound is needed to absorb that energy. This is a common theme among every Research Paper read to date! All of these Reports are concerned with the predicting of fire behavior and not what to do after you have predicted it.
In other words, once we know what the fire is producing in Btu or Watts per square meter, now what? It is this “Now What” that FireBridge tells you what you need, it is that other side of the same equation that is/has been missing.
The elements that were looked at and included in Rothermels model and later reduced to the form of a Nomogram included:
Heat Required for Ignition
Propagating Flux
Reaction Intensity
Effect of Wind and Slope
Approximate Rate of Spread
The Heat Required for Ignition
Rothermel, states this is dependent upon ignition temperature, moisture content of the fuel and amount of fuel involved in the ignition process.
So just what is the ignition temperature of a fuel?
First this is stated to be:

Qig is the heat of pre ignition. The amount of heat required to bring a unit weight of fuel to ignition and is stated in terms of Btu/lb.
f is the bulk density, fuel size
Mf is Ratio of fuel moisture to oven dry weight
Tig is ignition temperature
Propagating Flux
This is usually used to mean the rate of heat energy transferred per surface unit. That is, Btu/ft^2. Propagating commonly has the meaning to spread out, to influence etc. And Flux generally means the action or process of flowing out. Together in Fire would mean, “Heat flux (Ф) can be defined as the rate of heat energy transfer through a given surface (W), and heat flux density (φ) is the heat flux per unit area (Wm²).” However, Watts per square meter are fairly recent units in the US, we have used Btu per square foot and for the Flux Density, Btu per pound, during the time of the publication. So, it would or could also include the Btu rates.
Catch that statement?
HEAT ENERGY TRANSFER THROUGH A GIVEN SURFACE.
[Radiant heat, IS Infrared Radiation and “transfers from outside the fuel, through the surface of the fuel into the center”, drying out the contained moisture and reducing the time for actual ignition temperature to be reached upon flame impingement coming in contact, or the actual surrounding area temperature being reached first.] Much Like the Sun’s effect.
Thus, on the upper right quadrant of the nomograms, the Propagating Flux is the Heat Per Unit Area as Btu per square foot per minute and mathematically is Ip. We will see later that Rothermel refers to this figure as “reaction intensity” or as the Ip suggests, Propagation Intensity. This also is the number that FireBridge uses for its spreadsheet.
He states that there are two components to this figure. The Horizontal component and the Vertical Component. The vertical being more significant in upslope wind-driven fires because the FLAME tilts over the potential fuel, thereby increasing the radiation, but more significant he says is it will cause a direct flame contact and convective heat transfer to the potential fuel.
(I talked of radiation before in the form of the solar infrared radiation, very much the same effect is happening there also).
The Reaction Intensity is the Energy Release Rate. This is listed by his equation as:

Here the Reaction Intensity, mass loss rate per area in the fire front, in lbs per square foot per minute and multiplied by the heat content, h in Btu/lb.
The Effect of Wind and Slope, are also used but we do not used them in the FireBridge spreadsheet directly or separately, we only use the final outputs derived from the Nomogram and those outputs already contained the wind and slope factors before they became nomogram outputs!
Therefor it is not necessary to duplicate another complex process when the numbers are already established.
Then the Approximate Rate of Spread is used and shown on page 6 as:
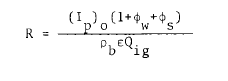
Фw = additional propagating flux (spreading heat) by wind
Фs = additional propagating flux (spreading heat) by slope
Both of these, Rothermel states are dimensionless coefficients. For understanding purposes, think of a hose coefficient as dimensionless. You use the number with other numbers to derive a computational result.
Ip = Propagation Intensity.
Remember the Propagation Intensity is Reaction Intensity and is in Btu per square foot per minute.
The Final Results of all of the formulas that Rothermel has done are then later made into a nomogram in about 1976. We use them all the time and they are listed as NWCG publication PMS-436-3. Below is an example of what the equations from Rothermels work represent when made into the mathematical equivalent of a graph.

Above, you can see starting in the lower left quadrant, Rothermel has taken care of the elements of slope and wind. To the right the Effective Mid Flame wind speed in Miles Per Hour. Then in the upper left corner is the ability to factor in the dead fuel moisture in percent (Pending Fuel Model, live fuel moisture will be listed as well). Upper Right quadrant is the place that you start and then end back up at. It shows the following elements that would, when finished, provide you with the following pieces of information.
Heat per Unit Area in Btu per square foot.
Rate of Spread in Chains per Hour
Fire intensity in Btu/sec/foot
Fire Flame length
The FireBridge Spreadsheet uses Rothermels numbers in the form of the Nomogram outputs AS the Spreadsheets INPUTS to then create a BRIDGE.
In this screen shot (below) you can clearly see that we use the outputs on the upper left side as the inputs (Green Text). You can see:
Rate of Spread chains per hour (this is converted to feet per second in the next column to the right)
Heat Per unit Area (this is the reaction intensity)
We then are able to compute the spread intensity in the form of the Btu per foot per second in the White colored text under Fire Generated Btu/s.
We have added a Fire Line Length in order to obtain an area so we may be able to determine the Btu being generated for the area involved.
We add Aircraft load size, Aircraft speed and Estimated Drop width to be able to determine the number of loads required.

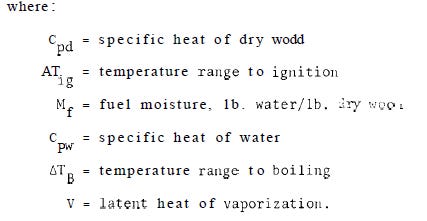
Page 7 of Rothermel’s report under Heat Sink speaks of ignition temperature and Latent Heat of Vaporization of the moisture. This is an important aspect because you can think of this as a “time lag” between the amount of moisture and the amount of heat needed to gas off that moisture before the fuel is low enough in moisture content to ignite. I speak of Specific Heat, Latent Heat and the Thermal Capacity of water during Engine Academy and I also wrote about it in my book on pages 8 & 9.
Latent Heat is the amount of heat absorbed or released by a substance while it is passing between the liquid and gaseous phases. Thus Water turning to steam is Latent Heat process. Rothermel also uses the same term for the Specific Heat of dry wood also on page 7 of his report.
Specific Heat is defined as a specific thermal capacity of a substance and is the amount of heat that is required to raise the temperature of the material. More specifically it is the amount of heat required to raise 1 pound of a substance 1 degree Fahrenheit. Rothermel thus takes into account for this in the equations and is reflected in the Nomograms for both specific heats of wood and water (which also includes boiling temperature at altitude), so they are already factored into the model!
I also want to interject another point here. The Fuels absolutely CANNOT generate more BTU intensity than they already possess. What allows a fuel, i.e. Tree or shrub to exhibit a seeming “extreme” nature of fire behavior is the fact the internal fuel moisture component has reach such a low state that there is nothing to slow the process of this fuels heating to ignition temperature to reaching its maximum output capacity. We simply call this Extreme Fire Behavior.
Rothermel then lists on Page 7 the Temperature to Ignition. On page 8 Rothermel states that Moisture is the primary independent variable in the evaluation of Ignition heat.

So if we know that water absorbs heat, and if we know how much heat a fire is producing, would can construct a bridge to tell us how much water we need.
Since water absorbs heat on a Btu per pound basis, and Fire generates heat on a Btu per pound basis, then we have a like unit we can use to determine the number of pounds of water required!
We need to have the Temperature to boil lapse rate for the altitude factor.
For 5,000 feet and a water temperature of 50 degrees Fahrenheit, water will absorb approximately 1,123 Btu per pound of water. If we have a SEAT that can carry 820 gallons, then that plane can hold a heat absorption capacity of about 7.7 million Btu worth. And a BAE-146 can hold around 28,100,000 Btu worth of Absorption.
If we then look at the amount of Btu being generated and then divide this by the amount of Btu we have to absorb heat, this result will tell us the approximate number aircraft of that same load you need to knock down a fire. Again basing this off of Rothermels fuel model report from 1972.
The FireBridge Spreadsheet then has other elements created to determine the required coverage level for application, and what the drop with should be, regardless if you can achieve that or not, is not the point, you can now use a sheet to determine the amount of water necessary and be fairly accurate since it is based upon the same engineering data that was used to create the nomograms.
The Nomograms never tell you and cannot tell what resources are required, what type, or how many as that was not the original purpose, nor will they tell you how they can be estimated. FireBridge bridges this “operations” gap by again using the Outputs of the Upper right Quadrant, as Spreadsheet inputs.
Download the Trial version of the FireBridge spreadsheet and compare it to a nomogram model. Engine Pump Calc & FireBridge Installers
Even Behave Plus 6 use the Technical reports from as early as the 1960.s the 1970’s as well as others into the 2000’s to derive their behavior models. Like the Nomograms however, they do not tell you how to estimate the quantity of water to absorb such heat energy. While it is a fantastic piece of software and certainly has its place, the other side of that same and old problem still needs to be presented.

https://bio.libretexts.org/Bookshelves/Introductory_and_General_Biology/Book%3A_General_Biology_(Boundless)/02%3A_The_Chemical_Foundation_of_Life/2.14%3A_Water_-_High_Heat_Capacity